Terry Cavanagh's Super Hexagon is the hardest game I've ever played. The gameplay is addictive, to say the least. The feeling is akin to what I imagine slot machine play must feel like to a gambling addict. Except these are the penny-slots. A single game can cost less than 5 seconds before you crash into one of the infinite, endlessly collapsing geometric shapes. There is no natural end, just a series of checkpoints, the last of which ("Hexagon") comes at 60 seconds. So given that a typical game for me lasts about 8 seconds, how many times do I have to play until I surmount the final barrier?
Gathering statistics
The goal of Super Hexagon is to dodge an endless stream of collapsing line segments and survive as long as possible. First I generated some data on my gameplay. I played 150 consecutive games on "hexagonest" mode and recorded my score (survival time) for each. I have already been playing this game off and on for about a month, so there's reason to believe that my learning curve is relatively flat. Additionally, I played a few warm-up matches before recording statistics.
One of my central assumptions will be that my performance from match to match is stationary, that is, my score on match \(n\) is independent of my score on previous matches and does not depend on how many matches I have played.
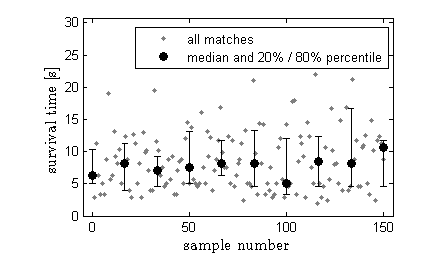
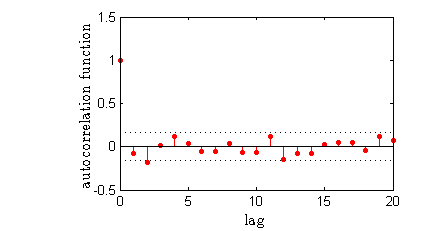
If I was getting better over time, I would expect my median performance to shift upwards. The plot above shows the outcomes of all the matches in light gray and the medians (and 20% and 80% percentiles) for each group of 15 matches. I don't seem to be improving (or getting worse) over time. Secondly my performance on match \(n\) is uncorrelated with my performance on match \(n-1\) (corresponding to a lag of 1 in the autocorrelation function shown below). The outcome of the Ljung-Box test also comes up negative for a lag of 1, confirming what we can already tell visually. Namely, that doing well (or poorly) on a match doesn't cause me to do any better (or worse) on the next match.
Extreme distributions
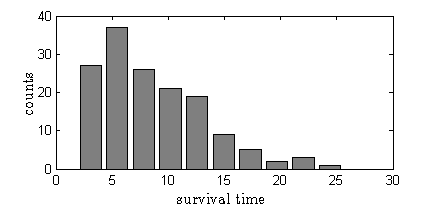
So if my match-to-match performance is a stationary process, what is the distribution of survival times? As expected, I typically fail early and often. The game presents a variety of different challenges, but they are randomly generated each time, so there's reason to believe that my failure statistics might follow an exponential distribution. Why is that? Well, let's assume that in each instant, my failure probability is constant (because the game presents the same challenge, on average, at every moment). Therefore my tendency to make a mistake is a Poisson process.
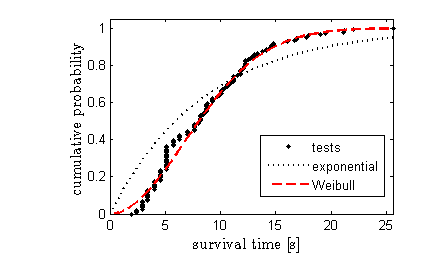
The cumulative distribution function \(F(t)\) gives the probability that the failure time will be less than \(t\). So the probability of exceeding a certain threshold is \(1−F(t)\). The exponential distribution, \(F(t)=1−e^{−λt}\) yields a very poor fit to the data. The two-parameter Weibull distribution function, \(F(t)=1−e^{(t/τ)^k}\) does much better. We'll look at the key difference between these distributions later.
Waiting for a Black Swan
How do we predict the probability of occurrence of an event that we've never witnessed? Nassim Nicholas Taleb refers to this kind of event as a Black Swan, especially if it has a disproportionate impact, like a market crash or extreme flood.
First, [A Black Swan] is an outlier, as it lies outside the realm of regular expectations, because nothing in the past can convincingly point to its possibility. Second, it carries an extreme 'impact'. Third, in spite of its outlier status, human nature makes us concoct explanations for its occurrence after the fact, making it explainable and predictable.
Nassim Nicholas Taleb, The Black Swan
But how hard could it be to predict? If we trust that we have modeled the underlying distribution properly, why not just extrapolate out to 60 seconds and calculate the probability of success? Let's call the probability that the survival time exceeds 60 seconds \(P_{60}\). The probability that I will succeed after \(n\) tries is
The number of attempts I will need to make in order to be 95% certain of success is \(\frac{\ln{(1-0.95)}}{\ln{(1-P_{60})}}\). Extrapolating the two-parameter Weibull distribution to find \(P_{60}\) and assuming that each game takes 9.6 seconds each leads a prediction of 2 billion years. I could do better things with that time, like maybe finish my PhD.
The trouble with tails
The problem with predicting extreme events by extrapolating mundane data is that the prediction is extremely sensitive to the shape of the tail of the distribution (the shape at large values). There is some statistical uncertainty in the fitting parameters, in this case, for \(\lambda\) and \(k\) for the Weibull distribution. Depending on the confidence level you select (95% for many applications), each parameter is expressed as \(p\pm \epsilon\). By taking the largest and smallest values for \(\lambda\) and \(k\), we get two new distributions from which we can calculate two new time estimates.
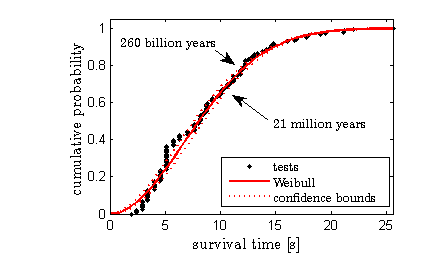
The confidence bounds are shown with dotted red lines. The tails of all three distributions are indistinguishable, but they give very different estimates. The lower estimate predicts 21 million years, while the upper one predicts 260 billion years or 20 times the age of the universe! Mind you, these estimates come from the statistical uncertainty of the fit and do not represent upper and lower bounds, in any sense, of the actual time required. So clearly, the prediction of extreme events is extremely sensitive to the shape of the tail. So what governs the shape?
Beginner's Luck vs. "Flow"
The Weibull distribution (and the exponential distribution, which is just a special case where \(k=1\)) is often used to model the time-to-failure of parts or materials, or the time between discrete events like earthquakes or floods. If the distribution of times-to-failure is known, the instantaneous failure risk (the probability of failure occurring in the time interval \(t\) to \(t+dt\) can be calculated. If \(P(t)\) is the cumulative distribution function of failure times, the failure risk is
So, for the Weibull distribution (\(F(t)=1-e^{-(t/\lambda)^k}\)), the failure risk is
So the failure risk follows a power law with time. For the special case of an exponential distribution (\(k=1\)), the risk is constant with time.
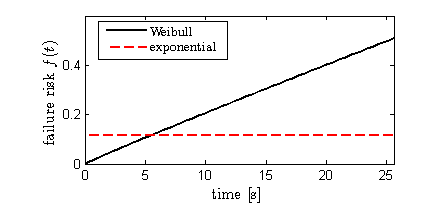
Why might the failure risk change over time? Super Hexagon requires concentration (also the ability to not blink...) so your tendency to make a mistake may increase as you lose mental focus. After some time though, I've found that I lose my sense of time somewhat and experience what some call "flow." Additionally, the pace of the game increases at the beginning and then stabilizes, until speeding up again after 60 seconds. So I might expect that my failure risk increases at first (which is consistent with the curvature of the cumulative probability distribution near zero) and then levels off eventually. The behavior of \(r(t)\) determines the shape of \(F(t)\) and therefore the shape of the tail.
There's no reason to assume that the failure risk \(r(t)\) follows a power law for all times. In fact, we can derive the time-to-failure probability distribution given an arbitrary (integrable) risk function. We want to calculate \(F(t)\), the probability that failure has occurred before time \(t\). Of course this is just \(1−G(t)\), where \(G(t)\) is the probability that failure has not occurred. This must be equal to the probability of failure not occurring in the interval from \(0\) to \(\Delta t\), AND the probability of failure not occurring in the interval \(\Delta t\) to \(2\Delta t\), etc. The failure probability in each interval is assumed to be independent, just like coin flips, so we can just multiply the probabilities of no failure in each interval. Dividing up the interval \((0,t)\) into equal intervals of size \(\Delta t\) and evaluating \(r(t)\) at the center of each interval, we have
Taking the natural log of both sides, the product on the right-hand-side becomes a sum.
If we let \(\Delta t\) shrink to zero, the sum becomes an integral, and the argument \(\ln{(1-r(t))}\) is approximated by its first order Taylor expansion, \(\ln{(1-r(\Delta t))}\approx-r(\Delta t)\). Therefore,
Now we can evaluate \(F(t)\) for an arbitrary risk function. I'll assume that my failure risk becomes constant after 10 seconds. The cumulative probability distribution for this model is \(F(t)=1−e^{I_0−(t−t_c)/\mu}\), where \(I_0\) is the value of the integral up to the cutoff point \(t_c=10\) seconds. The fit looks like this:
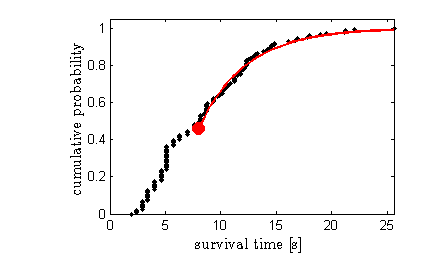
This model also leaves out the uncertainty in the first 10 seconds of the game, which has its own statistical problems but isn't relevant to predicting long times. The new model predicts that I will have to play the game for 150 days. That assumes constant gameplay without eating or sleeping. That might sound daunting, but it's a far cry from 260 billion years!
Why does this matter? First, it's fun! Second, this dataset is an excellent example of how prediction of extreme events is very sensitive to how we model the tail of the probability distribution. We have to do more than selecting a model and then optimizing the goodness-of-fit. For best results, we should model the tail of the distribution with a equation which is based on the underlying phenomena we are trying to predict.
Of course, in the time it took me to write this, I bet I could have gotten better at this stupid game...